For the past six months or so, at the behest of old college chum "SteveJ", I've been managing a Yahoo fantasy baseball team called, for no particular reason, the Battlin' Boomers. The season is over, and it's time to review strategies that did and didn't work.
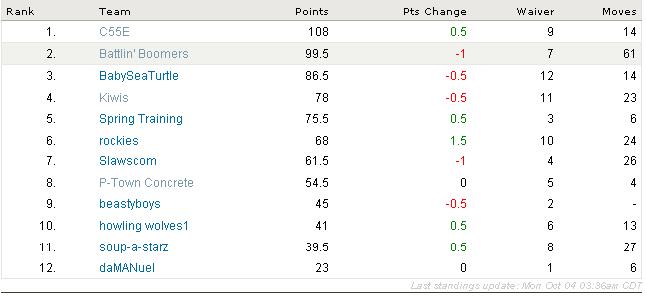 To start with, here are the final season standings for the Southwest Sluggos, organized by Commissioner "SteveJ". The Boomers' second place finish, while respectable enough for a rookie manager, leaves room for improvement. It's obvious that I was one of the most activist managers in the league, with more than double the number of "moves" (adds/drops of players from the team roster) of any other manager. There was a reason for this, as will become clear in a future discussion.
.....
 Now let's look at the overall points won by each team in the league. For those unfamiliar with rotisserie-league fantasy baseball, here's how it works. In each statistical category, teams are ranked from 1 (worst) to 12 (best). The ranks are then added up into a total score. Theoretically, a team that was tops in every statistic in a 12-team, 10-category league could get a maximum score of 120. As you can see, "C55E" came pretty close to doing this. At least I lost to a very strong competitor. The Boomers' rankings are strong across the board, with my weakest stats being Home Runs, Stolen Bases, (Batting) Avg., and ERA (Earned Run Average). The next chart will help cast more light on this. It is worth noting that throughout the season, I tried to manage to my weaknesses; that is, I consciously made an effort to be no worse than average in any category, and sought out players who would improve my team's weakest areas. Some fantasy-baseball commentators argue that one should concede one or two categories in order to excel elsewhere. I disagree. In my (admittedly limited) experience, it's easier to rise from awful to mediocre than to rise from mediocre to the top of the rankings, especially when one or two teams are accumulating massive "overkill" stats in particular categories. And the ranks from 1 to 6 count just as much, in the final total, as the ones from 7 to 12.
.....
 This chart shows the Boomers' ranking in each stat relative to the other teams in the league. Brown "tabs" indicate where they were tied with another team. Measured in terms of raw totals, rather than rankings, everything looks pretty good except for HRs, SBs, and AVG, which look awful. And yet I'm not terribly dissatisfied with the HR and SB rankings. Rankings, not raw totals, are what counts in rotisserie baseball, and despite the towering leads that the category leaders in HRs and SBs accumulated, the Boomers still came out above average in rankings. In achieving massive "overkill" totals in one statistic, about half the teams that ranked very high in one of these categories had below-average results in the other, suggesting that they relied too much on one dimensional players, "sluggers" or "speedsters", and did not achieve a good balance between the two. (See second chart.) The exceptions: C55E and the Kiwis, both of whom are notable for having drafted several multi-dimensional players with both exceptional power and exceptional speed. (C55E, evidently, was more selective than the Kiwis in terms of batting average.) The Boomers, sadly, had only one season-long player, the Phillies' Jayson Werth, who put up notably above-average results in both HRs and SBs and also had a better-than-average batting average. The other guys in my lineup tended to excel in one or two categories, being either powerhitters, or speedsters, or contact hitters whose high batting averages allowed them to rack up a lot of runs or RBIs, but did not excel in all three of those categories. By very actively swapping them out from one day to the next, I kept a good balance in overall production, but could not match the productivity of teams that had rosters full of players doing all three at the same time.
.....
Next up: Draft strategy (or lack thereof), and its consequences.
2 comments:
I read an interesting article on draft strategy. As we learned, about 40% to 50% of managers quit managing their teams. What this means is that if you carefully manage your team and max out the games played, you will score points in counting statistics, like HRs and SBs. However, it's extremely hard to make up ground on averaged stats, like batting average and ERA.
Looking forward to next season. Too bad your not into fantasy basketball.
SteveJ :)
Steve, you're right about the potential impact of quantity (maxing out the games played/innings pitched) vs. quality. It is possible that, if team stats were adjusted in proportion to the number of games played, the Boomers (who did, in fact, record more games-played and innings-pitched than most other teams) would not look quite so good. It's also possible that their good production of "counting stats", in relation to their mediocre batting average, is the result of the way I designed the Excel spreadsheet that I used to evaluate player performance. Since a player's contribution to the team's cumulative batting average on any given day is harder to account for than his contribution to R, HR, RBI, and SB, I omitted it from the spreadsheet and simply calculated the "counting stats" produced per at bat. This is related to overall effectiveness-per-at-bat, obviously, but does not take into account base hits which boost the batting average but do not result in runs scored or bases stolen.
Post a Comment